Anti-equilibrium Archive

0

EU oil market. The Port of Gdansk is among the leading importers


By Marek Grzybowski

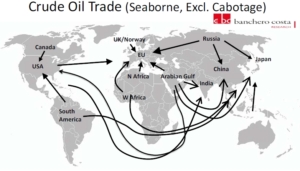
About 2.16 billion tonnes of crude oil were pumped through marine fuel terminals, of which the European Union’s marine terminals reloaded over 470 million tonnes in 2023. This result was surpassed by the economy of the People’s Republic of China, which imported 512 million tons by sea in the period January-December 2023, says Banchero Costa in the latest report. The Port of Gdansk is among the leading EU ports transshipping crude oil.
The war in Ukraine and disruption in supply chains made it another good year for oil trading companies. Demand for this energy raw material has increased despite high oil prices and the economic recession in many markets.
Despite the slowdown in many industrial and consumer markets, in the period January-December 2023, global transport of crude oil by sea increased by 5.3% y/y and reached 2,160.6 million tonnes, according to information based on data from observations of tanker traffic conducted by Refinitiv Maritime, excluding all cabotage trade.
In earlier years, global seaborne crude oil shipments were lower. In the period January-December 2022, they exceeded 2,050.9 million tons, and in 2021, 1,886.3 million tons were loaded onto tankers, while in 2019, 2,110.5 million tons were transported by sea between fuel terminals.

Persian Gulf – over 40% of global supplies
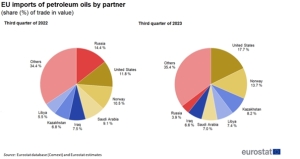
The dominant region and source of supplies is the Persian Gulf region. In the period January-December 2023, supplies from oil fields located in this region decreased by 1.4%. y/y to 869.1 million tons. Arab oil is still the dominant source of supply for many recipients, and recently also for Poland. Supplies from the Persian Gulf accounted for 40.2% of global maritime oil trade in 2023.
Exports from Russian ports increased in 2023 by 5% y/y to 229.5 million tons. This is 10.6% of the supply in global crude oil trade. From the USA, exports of this raw material increased by 19.5% y/y to 197.2 million tons. From West Africa, oil exports last year increased by 2.5% y/y and reached 174.8 million tons. Exports from South America increased by 20.8% y/y. and 157.6 million tons were loaded onto tankers. Exports from the oil fields of Northwest Europe increased by 3.4% y/y to 111 million tons.

China’s economy generated demand for 23.7% of global supplies
The largest maritime importer of crude oil in 2023 was the PRC. China’s economy generated demand for 23.7% of global supplies. Oil supplies to China increased in the period January-December 2023 by 16.6% y/y to 512 million tons, while a year earlier it was over 70 million tons less (439.9 million tons in 2022).
India’s imports increased by 1.9% y/y to 228.2 million tonnes. This means that India generates 10.6% of global demand. The South Korean economy imported +2.7% more in 2023 than the previous year. Fuel terminals pumped 140.4 million tons of crude oil from tankers. Japan reduced imports by 8.1% y/y. 121.6 million tons of crude oil were unloaded at the fuel terminals of Japanese ports.

The European Union is the second global importer
The European Union is the world’s second largest importer of crude oil by sea. In 2022, it overtook China. However, in the period January-December 2023, imports by sea to the European Union (27) increased at a rate four times lower than imports from China. It was only 4.7% y/y. As a result, tankers delivered 472.4 million tonnes to fuel ports in the EU. In 2023, the EU accounted for 21.9% of global crude oil trade.

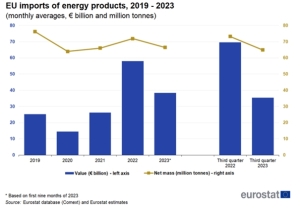
EUROSTAT points out that “the observed significant fluctuations in EU oil imports [Ministry of Economy] are a consequence of high price volatility. The share of crude oil [in value terms – Ministry of Economy] in total EU imports increased from 9.1% in 2021 to 11% in 2022 and decreased slightly to 10.6% in the first three quarters of 2023.
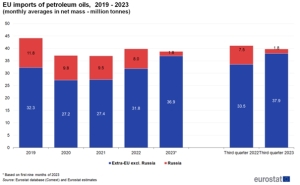
EU countries, including Poland, increased their imports of crude oil. In 2022, the economies of EU countries imported 388.8 million tons, a year earlier it was over 402.5 million tons, while in 2019 the EU needed 446 million tons of oil imported through fuel terminals.

Increased spending on oil imports
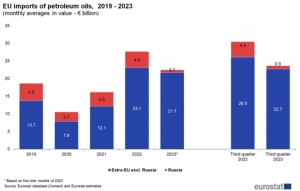
These volumes also translated into an increase in spending on crude oil imports. The average monthly import from Russia decreased in 2021-2022, but due to rising prices, the value of imports from Russia also increased (EUR 0.6 billion). Imports from other non-EU partners increased, which meant that EUR 10.9 billion more had to be paid for supplies, according to EUROSTAT. – In the first three quarters of 2023, the trend was reversed, and the total average values decreased by 19% compared to 2022 (from EUR 27.6 billion in 2022 to EUR 22.4 billion in Q1-Q3 2023 y.) – says EUROSTAT.

About 14% of the crude oil delivered to the EU by tankers in 2023 was transported on VLCCs, about 43% arrived on Suezmax tankers and about 42% was offloaded from Aframax ships, reports Banchero Costa Research.
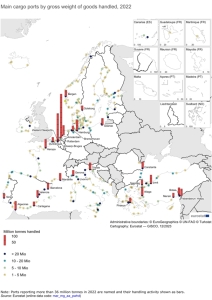
Rotterdam was the port with the largest volume of received oil delivered to the EU. In 2023, 101 million tons of crude oil reached the refineries located in its zone by sea. In second place was the Northern Port in Gdańsk, whose terminals pumped 37.6 million tons (in 2022 – 25.5 million tons).
– Naftoport has become an oil hub for the region. It is through the Gdańsk fuel terminal that the refining needs of both Poland and our closest neighbors are secured. Naftoport last year reloaded a total of 36.6 million tons of crude oil and fuels. Part of this cargo is supplies to German refineries. After cutting off supplies via the “Przyjaźń” oil pipeline from Russia, Poland became the most important gateway for them, informed the Port of Gdansk Authority.
In third place is the seaport of Trieste, to which tankers delivered 36 million tons. Next are the fuel terminals in Fos (22.0 million tons), Le Havre (19.3 million tons), and Wilhelmshaven (17.9 million tons). The following ports handled less than 15 million tons in 2023: Cartagena (14.3 million tons), Sarroch (12.2 million tons), Augusta (11.4 million tons), Algeciras (10.2 million tons), Tarragona (9, 8 million tons), Lysekil (9.5 million tons).

Turbulences in crude oil logistics
European Union countries have been hit hard by the turmoil in crude oil logistics. Ship deliveries had to replace pipeline transport. It was necessary to change the countries and ports from which oil was imported in 2023. Not everything went as expected and holes appeared in the sanctions through which oil from Russia leaked.
However, changes in logistics chains have changed transshipment in many countries and ports, both on the export and import side. In the period January-December 2023, supply from Russian ports (including Kazakh oil) decreased by 40.4% y/y compared to 2022 and 47.9% compared to 2021 compared to 2021. In 2023 58.6 million tons were exported through Russian terminals, while in the previous year it was 98.4 million tons, and in 2021 112.5 million tons.
Ukrainian drone attack on the ports of St. Petersburg and Ust Luga caused the Governor of the Leningrad Oblast, Aleksandr Drozdenko, to announce an alarm for ports in January and introduce the highest level of threat to critical infrastructure facilities. The alarm was announced in all areas of the oblast. In particular, it applies to terminals with installations located in the ports of Vyborg, Vysotsk and Primorsk.
Currently, Novorossiysk is the largest port exporting crude oil to the EU. In 2023, it amounted to 47.4 million tons. Russian ports have dropped in the ranking of oil suppliers to the EU over the last 2 years. However, they are the fourth supplier of crude oil to the EU transported by sea.

USA, Norway and Great Britain in the oil gap after sanctions
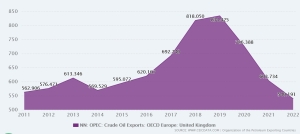
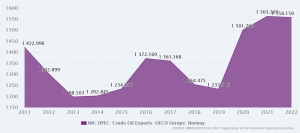
This is only 12.4% of the volume in the period January-December 2023. British and Norwegian oil from the North Sea accounted for last year. 18.6% of deliveries to the EU. Production companies from North Africa provide 17.3% of supplies, and 15.4% of the oil imported by EU countries arrives from the USA via tankers.
As a result of the sanctions imposed on Russian oil, supplies to the EU from the North Sea (Norway and Great Britain) increased by 14% year on year. In the period January-December 2023, 87.8 million tonnes arrived by tankers from British and Norwegian offshore drilling to EU ports.
Imports from North Africa (including Sidi Kerir) increased by 17.3% y/y to 81.7 million tonnes in January-December 2023. Imports from the US increased by 41.5% y/y, reaching a new record all-time amounting to 72.8 million tons.
Supplies from West Africa to Europe increased by 8.2% y/y to 54.4 million tonnes in 2023. Direct supplies from the Persian Gulf also increased sharply. In 2023, the supply dynamics reached 32.2% y/y to 45.3 million tons. The volume of deliveries from Turkey (Ceyhan) decreased by 32.7% y/y to 23 million tons from 34.2 million tons in January-December 2022.
The sanctions imposed on Russia have resulted in a significant decrease in direct imports of Russian oil to the European Union. Now the country’s oil comes indirectly through operators and traders using “gray” or “black” fleets.
Transfer ports are also cleverly used, where oil from ships carrying Russian oil is transferred to ships operating on official registers. STS operations – pumping oil in bays or in port roadsteads – are also common.
Russian oil also reaches EU ports in the form of products produced in refineries of third countries that have not imposed sanctions. And so, thanks to leaking sanctions, oil from Russia reaches European Union ports.


0

Europe of coal and steel depends on seaports

By Marek Grzybowski

Global maritime coal trade accelerated in the last months of 2023 and returned to pre-pandemic trade levels. In the period January-December 2023, global sea coal shipments increased by 6% y/y to 1,341.2 million tons (excluding cabotage), based on ship tracking data from AXS Marine, Banchero Costa reports in the latest report. Last year global demand for steel also increased to 1.8% in 2023 to 1.814 billion tons. and in 2024 by 1.9% – we read in the February report of the World Steel Association (WSA – Worldsteel).


The situation on the European market has changed significantly since the creation of the European Coal and Steel Community. Let us recall that this organization was established on the initiative of French politicians. The originator of the idea was Planning Commissioner Jean Monnet, and the initiative was implemented by Foreign Minister Robert Schuman. The idea was to eliminate conflicts at the interface between the French and German raw materials markets. The initiative was supported by neighboring countries interested in economic cooperation.

European Coal and Steel Community
The European Coal and Steel Community was established in 1952. The duration of its operation was set in the treaty at 50 years. The treaty was signed by France and the Federal Republic of Germany, as well as Belgium, the Netherlands, Luxembourg and Italy. Since then, the coal and steel market has transformed into the single market of the European Union.
The Saar area, the Ruhr area and Lorraine have completely changed their “mining and ore” face for over 70 years. However, coal and steel are still its important components. After years of transformation, European countries became increasingly dependent on imports of coal and steel.

The EU accounted for 6.6% of global coal shipments by sea in 2023. Imports of coal through sea ports to the EU increased by 38.2% y/y to 127.6 million tons compared to 2022. Demand for steel in EU countries and Great Britain in 2023, according to WSA information, decreased by 5.1%. on an annual basis, and in 2024 it is expected to increase by 5.8% y/y.

– In 2023, much more coal was transhipped in bulk carrier terminals of EU seaports than in the period January-December 2022. Two years ago, transporters and cranes transported over 1,265.5 million tons between ships and quays in EU terminals. For comparison, in 2021 in 2019 it was 1,254.2 million tons, and in 2020 and 2019, 1,196.5 million tons and 1,309.8 million tons were unloaded between ships and storage yards, respectively – says Banchero Costa Research in its latest report.

The demand for sea transport of coal resulted in high activity of exporters. In the period January-December 2023, coal deliveries to the market from Indonesia via the Pacific routes increased by 10.5% y/y to 496 million tons. Mines and ports in Australia also benefited from the increase in demand. Exports from the Antipodes increased by 4.8% y/y to 344.9 million tons. From Russia, exports to the global market decreased by approximately 2.4% y/y to 184 million tons and from South Africa, coal loads decreased by 0 .3% y/y to 60.4 million tons.

Deliveries from the USA increased by 16.7% y/y

However, deliveries from the USA increased by 16.7% y/y to 86.6 million tons. Bulk carriers from Colombia delivered 2% more coal y/y to ports around the world, transporting 56.4 million tons of this black cargo in January -December 2023. Bulk carriers delivered 50.2 million tons from Canada via the Atlantic and Pacific (an increase of 10.2% y/y), and from Mozambique 23.7 million tons (an increase of 14.6% y/y).

Coal imports on sea routes were created by the People’s Republic of China, Japan, India and South Korea. Interestingly, countries with high development dynamics and innovative economies are also large consumers of coal.
Banchero Costa Research analysts found that mainland China’s bulk terminals handled 48.6% more coal in 2023 than the previous year. 368.4 million tons of this cargo were received from ships at the quays in the period January-December 2023.

Imports to Japan decreased by 10.3% y/y to 160.5 million tons in 2023, imports to South Korea decreased by 4.4% y/y to 117.4 million tons, Taiwan imported 58.3 million tons, less by 4.3% y/y. Imports to India increased by 6.9% y/y to 240.8 million tons and to Vietnam by 54.2% y/y to 47.4 million tons.

EU – coal versus natural gas and renewable energy
The European Union is currently the fifth largest importer of coal by sea in the world, after China, India, Japan and South Korea. In 2023, EU countries created 6.6% of global demand for coal imports by sea.
While coal imports by sea to the EU increased in 2022 by +38.2% y/y to 127.6 million tons, in 2023 imports of this energy raw material dropped sharply by 30.4% y/y to only 88.8 million tons. This is the lowest volume of coal imports in recent years after 2020, when the world was affected by the Covid-19 pandemic.
In 2023, European countries returned to demand from the previous trend, which gradually abandoned coal as an energy source. Natural gas is back in favor. Gas imports from Russia to the EU cost Western European countries approximately EUR 1 billion per month, as we wrote in GospodakraMorska.pl.

The reduction in coal imports is influenced by the dynamically growing supplies of energy from renewable sources. As a result, already in 2020 we observed a decline in European demand for coal by 32.9% year-on-year, and earlier: by 18.3% y/y in 2019, by 7.6% y/y in 2018 – Banchero enumerates Costa.

US – the most important supplier to Europe in 2023
In terms of supply sources, for many years Europe, including Poland, was largely dependent on Russia. After 2022, the situation has changed dramatically. In 2021, as much as 44% of EU coal imports by sea came from Russian ports. In 2023, as a result of the sanctions imposed, this share dropped to 4.3%. This statistic also includes Kazakh coal transported through Russian ports. In the period January-December 2023, coal imports to the EU from Russian ports decreased by 83.6% y/y to only 3.9 million tons (including Kazakh coal).
The most important supplier to Europe in 2023 was the United States. EU countries from this direction met 27.3% of their needs for coal imported by sea. In 2022, deliveries of black cargo from the USA across the Atlantic to EU ports increased by 60.5% y/y to 26 million tons. In 2023, however, they decreased by 7.0% y/y to 24.2 million tons. The second largest supplier to Europe is Australia.
In 2023, 23.2% of the coal needed by the EU was imported to EU countries via the Pacific and the Suez Canal. In 2022, imports from Australia increased by 30.8% y/y to 20.9 million tons. However, in 2023 they decreased by 1.8% y/y to 20.6 million tons.
Colombia is the third supplier of coal to Europe with a share of 16.6%. In 2022, ships delivered 15.9 million tonnes to EU ports. Then deliveries increased by +89.2% y/y. But in 2023, demand from this direction decreased by 7.0% y/y to 14.8 million tons.
In fourth place was South Africa with a 9.1% share in European coal imports in 2023. In 2022, imports to the EU increased by 676.4% y/y to 16.0 million tonnes, but in 2023 . decreased by 49.5% y/y to 8.1 million tons. Indonesia provided only 5.4% of coal imports to Europe in 2023. Volumes from Indonesia to the EU increased by 1,148% y/y in 2022 to 5 .1 million tons, but decreased by 5.2% y/y in 2023 to 4.8 million tons.

Steel market
In 2023, global steel demand reached 1.814 billion tons. This information was provided by the updated short-term forecast of the World Steel Association (WSA). Worldsteel forecasts that in 2024, global demand for steel will increase by 1.9% y/y, to 1.849 billion tons. According to the World Steel Association, steel production in EU countries in 2022 decreased by 10.5% year on year – to 136.7 million tons. Overall, global steel production decreased by 4.3% y/y – to 1.83 billion tons.
Maximo Vedoya, CEO of Ternium and chairman of the Worldsteel economic committee, stated that “demand for steel is influenced by high inflation and high interest rates offered by banks,” reports Halina Yermołenko from GMK Center. According to Vedoya, activity in steel-consuming sectors has declined sharply since the second half of 2022, both in most industries and regions.
This trend continued in 2023, particularly affecting the EU and the US. The activity of the PRC economy has a significant impact on the global steel market. Several months ago, Worldsteel expected that the real estate market in China would stabilize in the second half of 2023. It was expected that the demand for steel in this country would increase by 2% y/y in 2023. However, the forecast for China for 2024 was still uncertain. And probably only when the Chinese New Year ends and the Year of the Dragon begins will we know more.
– We note that the Chinese economy is in the stage of structural transformation, which may increase volatility and uncertainty. Another uncertainty is related to regional conflicts and unrest. This could contribute to rising oil prices and further defragment the global economy, the association said in a statement.

Steel European Union
Last fall it was forecast that the demand for steel in EU countries and Great Britain in 2023, according to WSA forecasts, will decrease by 5.1% annually, and in 2024 it may increase by 5.8% y/y. In fact, imports of rolled steel during 11 months of last year decreased by 13% y/y
In the first 11 months of 2023, imports of finished products decreased by 13% y/y, including flat products – by 9% y/y and long products – by 25% y/y. In 2022, total imports of finished products decreased by 5% y/y. – informs Vadim Kolisnichenko in GMK Center, citing data from the Provincial Administrative Court.
– In the period from January to November 2023, the European Union (EU) reduced imports of steel (including semi-finished products) by 11% compared to the same period in 2022 – informs EUROFER in the “Economic and steel market outlook 2024” published in February -2025.” In 2022, overall steel imports also decreased by 7.3% y/y, while in 2021 they increased significantly by 32% y/y.
– In 2023, imports showed stable volatility, reflecting the fluctuations observed over the previous three years. After the outbreak of the Covid-19 epidemic, steel imports increased and showed some volatility in the second half of 2020. However, growth became much more pronounced in 2021, particularly in the second and third quarters, reaching all-time highs. These dynamics reflected favorable steel demand conditions until the end of 2021, while volatility continued in the fourth quarter of 2021 and throughout 2022, EUROFER reports.

The main countries supplying steel to the EU
The main countries supplying steel to the EU in the period January-November 2023 were India (increase by 7% y/y), South Korea (increase by 6% y/y). Steel supplies from the PRC decreased by 13% y/y and from Turkey (-51% y/y). Meanwhile, steel deliveries by sea to the EU increased in Vietnam (38% y/y), Taiwan (12% y/y), and Japan (32% y/y). These countries accounted for over 58% of all deliveries by sea.
In the flat products segment, imports of all types of products decreased over the 11 months of last year. In particular, imports of cold-rolled and hot-rolled flat products decreased by 27% y/y and 22% y/y, respectively, while imports of coated products decreased by 24% y/y and organic steel by 30% y/y.
Among long products, positive growth by 2% y/y. only records recorded it. However, deliveries of reinforcing bars and wire rod decreased by 31% y/y and 26% y/y, respectively. EUROFER forecasts that in 2023, explicit steel consumption in the European Union will decrease by 6.3% compared to 2022, to 129 million tons. At the same time, in 2022 this number decreased by 6.5% y/y, and in 2024 it is expected to increase by 5.6% y/y.
During the last 11 months EU countries have produced 117.6 million tons of steel and still need it. Three main producers last year. these are the steel plants of the PRC (952.1 million t), India (128.2 million t) and Japan (80 million t). Lower imports of steel, and especially coal, allowed ports to catch their breath after the shortness of breath in 2022. Also Polish ports.
In 2023, 2,825 thousand coal and coke were transhipped in the terminals of the Port of Gdynia. t (in 2022 – 3,403 thousand t.). In Gdańsk there were 13.4 million tons in 2023 and 13.2 million tons in 2022. In the terminals of Szczecin and Świnoujście, 4,310.6 thousand tons were recorded in the statistics. tons of coal in the period January – December 2022 and 2,937.6 thousand t in 2023

0

McKinsey: Women in the Workplace 2023

By Emily Field, Alexis Krivkovich, Sandra Kügele, Nicole Robinson, and Lareina Yee
Women are more ambitious than ever, and workplace flexibility is fueling them. Yet despite some hard-fought gains, women’s representation is not keeping pace. That’s according to the latest Women in the Workplace report from McKinsey, in partnership with LeanIn.Org.
This is the ninth year of the Women in the Workplace report. Conducted in partnership with LeanIn.Org, this effort is the largest study of women in corporate America and Canada. This year, we collected information from 276 participating organizations employing more than ten million people. At these organizations, we surveyed more than 27,000 employees and 270 senior HR leaders, who shared insights on their policies and practices. The report provides an intersectional look at the specific biases and barriers faced by Asian, Black, Latina, and LGBTQ+ women and women with disabilities.

This year’s research reveals some hard-fought gains at the top, with women’s representation in the C-suite at the highest it has ever been. However, with lagging progress in the middle of the pipeline—and a persistent underrepresentation of women of color1—true parity remains painfully out of reach.

The survey debunks four myths about women’s workplace experiences and career advancement. A few of these myths cover old ground, but given the notable lack of progress, they warrant repeating. These include women’s career ambitions, the greatest barrier to their ascent to senior leadership, the effect and extent of microaggressions in the workplace, and women’s appetite for flexible work. We hope highlighting these myths will help companies find a path forward that casts aside outdated thinking once and for all and accelerates progress for women.

The rest of this article summarizes the main findings from the Women in the Workplace 2023 report and provides clear solutions that organizations can implement to make meaningful progress toward gender equality.

State of the pipeline

Over the past nine years, women—and especially women of color—have remained underrepresented across the corporate pipeline (Exhibit 1). However, we see a growing bright spot in senior leadership. Since 2015, the number of women in the C-suite has increased from 17 to 28 percent, and the representation of women at the vice president and senior vice president levels has also improved significantly.

These hard-earned gains are encouraging yet fragile: slow progress for women at the manager and director levels—representation has grown only three and four percentage points, respectively—creates a weak middle in the pipeline for employees who represent the vast majority of women in corporate America. And the “Great Breakup” trend we discovered in last year’s survey continues for women at the director level, the group next in line for senior-leadership positions. That is, director-level women are leaving at a higher rate than in past years—and at a notably higher rate than men at the same level. As a result of these two dynamics, there are fewer women in line for top positions.

Moreover, progress for women of color is lagging behind their peers’ progress. At nearly every step in the pipeline, the representation of women of color falls relative to White women and men of the same race and ethnicity. Until companies address this inequity head-on, women of color will remain severely underrepresented in leadership positions—and mostly absent from the C-suite.

Four myths about the state of women at work

Myth: Women are becoming less ambitious
Reality: Women are more ambitious than before the pandemic—and flexibility is fueling that ambition
Myth: The biggest barrier to women’s advancement is the ‘glass ceiling’
Reality: The ‘broken rung’ is the greatest obstacle women face on the path to senior leadership
Myth: Microaggressions have a ‘micro’ impact
Reality: Microaggressions have a large and lasting impact on women
Myth: It’s mostly women who want—and benefit from—flexible work
Reality: Men and women see flexibility as a ‘top 3’ employee benefit and critical to their company’s success

More: McKinsey & Comapny

To view previous reports, please visit the Women in the Workplace archive


0

Deloitte – ESG zyskuje na znaczeniu

Inwestorzy z Europy Środkowej spodziewają się większej liczby transakcji w 2024 roku.

Blisko 90 proc. lokalnych funduszy private equity podejmuje lub planuje podjąć działania na rzecz ESG

Najnowsza edycja badania Deloitte Central European (CE) Private Equity (PE) Confidence Survey firmy doradczej Deloitte wskazuje, że prywatni inwestorzy z Europy Środkowo-Wschodniej z optymizmem patrzą w najbliższą przyszłość. 49 proc. przedstawicieli funduszy private equity spodziewa się wzrostu liczby przeprowadzonych transakcji. Chociaż poprawa nastrojów jest obserwowana od ponad roku, to jednocześnie inwestorzy zdają się zachowywać ostrożność w swoich prognozach. Na znaczeniu nadal zyskują kwestie ESG, które w swoich strategiach inwestycyjnych uwzględnia ponad połowa ankietowanych.

Opracowywany od ponad 20 lat indeks Central Europe PE Confidence Survey stanowi odzwierciedlenie nastrojów lokalnych uczestników rynku private equity. Na koniec 2023 r. jego wartość wyniosła 107 punktów, o 24 więcej niż sześć miesięcy wcześniej. Autorzy raportu zwracają uwagę na stały wzrost optymizmu przez trzy ostatnie badane okresy, co jest trzecim takim przypadkiem w historii badania. Jednocześnie zaobserwowana zmiana ma mniej dynamiczny charakter niż w poprzednich latach, a to, zdaniem ekspertów, świadczy o ostrożnym podejściu inwestorów do poprawiających się warunków rynkowych. Mimo to aż 86 proc. ankietowanych uważa, że najbliższe 12 miesięcy będą dobrym czasem dla działalności inwestycyjnej. W 2024 roku blisko połowa ankietowanych planuje skupić się na nowych inwestycjach. To niemal 10 pkt proc. więcej niż rok wcześniej. Co trzeci zamierza poświęcić się głównie zarządzaniu dotychczasowym portfelem spółek, a jedynie 15 proc. na pozyskiwaniu funduszy.

Chociaż najnowszy odczyt wskaźnika nastrojów jest najwyższy od półtora roku, to widać, że przedstawiciele środkowoeuropejskiego rynku private equity cechują się większą rozważnością niż w przeszłości. Jest to rezultat doświadczeń płynących z ponad dwudziestoletniego funkcjonowania w zmiennych warunkach rynkowych. Jednocześnie oczekujemy, że mimo wielu wyzwań gospodarczych aktywność prywatnych inwestorów w Europie Środkowo-Wschodniej powinna rosnąć. Dotyczy to zarówno strony popytowej, jak i podażowej, o czym świadczy odsetek ponad 40 proc. badanych kontynuujących proces sprzedaży mimo zmiennej sytuacji rynkowej – mówi Arkadiusz Strasz, partner w dziale doradztwa finansowego w Deloitte, M&A Transaction Services.

Aktywność funduszy w górę

Rozkład odpowiedzi dotyczących oczekiwań w stosunku do warunków gospodarczych potwierdza tezę o rosnącym optymizmie inwestorów. 42 proc. ankietowanych stwierdziło bowiem, że spodziewa się poprawy sytuacji rynkowej. To blisko trzykrotnie więcej w porównaniu do poprzedniej edycji badania. Jednocześnie o połowę spadł odsetek zakładających negatywny scenariusz. Ponad dwukrotny wzrost widać także wśród oczekujących wzrostu dostępności finansowania dłużnego. Tego typu odpowiedzi udzieliło 29 proc. badanych.

Na pytanie dotyczące aktywności rynkowej – przewidywanej liczby transakcji w 2024 roku, 49 proc. respondentów stwierdziło, że spodziewa się większej aktywności w tym obszarze. To niemal dwa razy więcej w porównaniu do połowy 2023 r. Wynik ten stanowi również o ponad 40 p.p. wyższy odsetek niż latem 2022 roku, kiedy to takich odpowiedzi udzieliło jedynie 6 proc. badanych. Analogicznie grupa wyrażająca pesymizm skurczyła się ponad dwukrotnie – do poziomu 14 proc. Na skłonność inwestorów do podejmowania działań wpływ ma m.in. koszt kapitału. Zdaniem co trzeciego badanego dostępność finansowania powinna w najbliższych latach wzrosnąć. Odsetek ten jest dwa razy większy w porównaniu do poprzedniej edycji ankiety. Prawie połowa badanych nie spodziewa się zmiany obecnych warunków, a co piąty zakłada pogorszenie możliwości uzyskania środków na inwestycje.

Chociaż inflacja pozostaje jednym z największych wyzwań dla współczesnej gospodarki, to z czasem tempo wzrostu cen, a co za tym idzie – wysokość stóp procentowych, powinno spadać. Oczekują tego m.in. prywatni inwestorzy, dla których dostępność kapitału stanowi podstawę działania. W miarę jak banki centralne będą odchodziły od restrykcyjnej polityki monetarnej, oczekiwania uczestników rynku private equity powinny stawać się rzeczywistością, co bez wątpienia przełoży się na wzrost aktywności funduszy w krajach Europy Środkowo-Wschodniej  – mówi Michał Tokarski, partner zarządzający działem doradztwa finansowego Deloitte w Polsce, lider zespołu M&A Corporate Finance.

ESG zyskuje na znaczeniu

Autorzy raportu podkreślają dalszy wzrost znaczenia czynników ESG dla uczestników środkowoeuropejskiego rynku funduszy private equity, m.in. w obszarze podejmowanych decyzji inwestycyjnych. Ponad 50 proc. przedstawicieli funduszy potwierdziło, że w swoich działaniach zwraca szczególną uwagę na te kwestie. Największy wzrost zaobserwowano wśród podmiotów nieposiadających strategii uwzględniającej ESG, ale planujących zmianę w tym obszarze – z 9 proc. w pierwszej połowie 2023 r. do 23 proc. sześć miesięcy później.Na pytanie dotyczące neutralności klimatycznej większość funduszy odpowiedziała, że znajduje się dopiero na początku drogi do zeroemisyjności. Odsetek podmiotów, które dotychczas wdrożyły zobowiązania i cele dekarbonizacji spadł o 8 p.p. do poziomu 18 proc. Jednocześnie zaobserwowano analogiczny wzrost wśród funduszy będących w trakcie opracowywania własnych celów klimatycznych. Jest to obecnie najbardziej liczna grupa badanych podmiotów, stanowiąca 42 proc wszystkich ankietowanych.

O rosnącym znaczeniu czynników środowiskowych, społecznych oraz związanych z ładem korporacyjnym najlepiej świadczy fakt, że ponad 90 proc. badanych podmiotów bierze je pod uwagę w swoich działaniach lub planuje to zrobić w przyszłości. Jednocześnie ubiegły rok był przełomowy z tego względu, że po raz pierwszy w historii spółka wchodząca w skład lokalnego funduszu private equity uzyskała prestiżowy status B Corporation, stanowiący zobowiązanie do aktywnych działań na rzecz ESG. W najbliższej przyszłości możemy się spodziewać dynamicznego przyrostu takich podmiotów, dla których zaangażowanie w zrównoważony rozwój będzie kluczową kwestią – mówi Irena Pichola, partnerka, liderka Sustainability & Economics Consulting CE, Deloitte.

0

Deloitte – Trendy Technologiczne 2024

Przedstawiamy sześć trendów technologicznych, które będą miały wpływ na rozwój firm w nadchodzących latach
Jakie trendy technologiczne zdominują najbliższych 24-36 miesięcy?
Trzy kluczowe siły napędzające (interakcja, informacja i obliczenia) oraz trzy kluczowe siły wzmacniające (biznes technologiczny, wzmocnienie rdzenia i cyberbezpieczeństwo oraz zaufanie) są fundamentem, na którym opiera się nasz raport “Deloitte Tech Trends”. W tej piętnastej edycji corocznego raportu omawiamy sześć głównych czynników, które pokazują, że w dobie maszyn generatywnych utrzymanie zintegrowanej strategii biznesowej, solidnych podstaw technologicznych i kreatywnej siły roboczej jest teraz dla organizacji ważniejsze niż kiedykolwiek.
W odniesieniu do wcześniej wspomnianych sześciu obszarów technologicznych, analitycy Deloitte opisują zachodzące zmiany i co roku przedstawiają prognozy rozwoju rynku w kolejnych 24-36 miesiącach. Jakie trendy z tegorocznego raportu Deloitte „Tech Trends 2024” mogą być rewolucyjne dla świata technologii i biznesu?

Trend technologiczny #1

Interfejsy w nowych sferach: Obliczenia przestrzenne i przemysłowe metawersum

W jednym z trendów opisywanych w zeszłorocznej wersji raportu “Po drugiej stronie lustra: przedsiębiorstwa w metaverse” przewidywaliśmy, że metaverse, czyli immersyjny internet, wkrótce stanie się pełnoprawnym narzędziem dla przedsiębiorstw, które odkrywają nowe możliwości interakcji, takie jak rozszerzona i wirtualna rzeczywistość (AR/VR).

W tym roku podkreślamy, że niektóre z tych technologii rozwijają się w nowych kierunkach. Po przejściu od zabawek konsumenckich do narzędzi biznesowych, technologie przestrzenne są szczególnie popularne w zastosowaniach przemysłowych, gdzie firmy koncentrują się na cyfrowych bliźniakach, symulacjach przestrzennych, rozszerzonych instrukcjach pracy i współpracujących przestrzeniach cyfrowych, które podnoszą w organizacjach poziom bezpieczeństwa i efektywności. Przewiduje się, że przychody napędzane przez przemysłowy metaverse osiągną prawie 100 mld USD do 2030r., znacznie przewyższając segment konsumencki (50 mld USD) i korporacyjny (30 mld USD).

Trend technologiczny #2

Nieuchronna kolej rzeczy: GenAI jako katalizator wzrostu

Filozofowie od dawna debatują, czy maszyny są zdolne do myślenia, lecz generatywna sztuczna inteligencja (GenAI) czyni tę kwestię nieistotną. Podstawowe działanie tych modeli ma wiele wspólnego z wcześniejszymi narzędziami uczenia maszynowego, ale dzięki zwiększonej mocy obliczeniowej, lepszym danym szkoleniowym i sprytnemu kodowaniu GenAI może imitować ludzkie zdolności poznawcze na różne sposoby. Bez względu na to, czy AI posiada inteligencję w kontekście filozoficznym, z pewnością ma przełożenie na zastosowania praktyczne. Otwiera to szereg możliwości rozwoju w przedsiębiorstwach – jeżeli maszyny potrafią zachowywać się, rozumieć i opowiadać historie jak ludzie, pytanie brzmi – w jaki sposób to wpłynie na biznes i szeroko rozumiany świat?

Trend technologiczny #3

Mądrze, nie ciężko: Wykraczając poza obliczenia siłowe

W miarę rosnącego znaczenia technologii w biznesie, firmy doświadczają coraz bardziej złożonych obciążeń i wyzwań. Klasyczne usługi chmurowe wciąż dostarczają wystarczającej ilości funkcjonalności dla większości codziennych operacji biznesowych, ale dla innowacyjnych zastosowań, które decydują o przewadze konkurencyjnej, pojawia się nowa potrzeba posiadania specjalistycznego hardware’u. Szkolenie modeli sztucznej inteligencji, przeprowadzanie skomplikowanych symulacji czy też tworzenie cyfrowych bliźniaków środowisk rzeczywistych wymagają zupełnie innego kalibru mocy obliczeniowej. Wiodące dzisiaj przedsiębiorstwa znajdują nowe sposoby wykorzystania istniejącej infrastruktury i dodawania nowoczesnego sprzętu i rozwiązań, aby jeszcze bardziej przyspieszyć procesy. Wkrótce niektóre z nich będą rozważać perspektywę wyjścia poza tradycyjne obliczenia binarne.

Trend technologiczny #4

Od DevOps do DevEx: Budowanie doświadczeń programisty

W miarę wzrostu postrzegania nowoczesnych technologii, jako czynnika różnicującego i istotnej części biznesu, talenty technologiczne stają się ważniejsze niż kiedykolwiek wcześniej. Natomiast obecne metody pracy pozostawiają wiele do życzenia pod względem efektywności. Aktualnie jednak coraz więcej firm przyjmuje nowe podejście, skupiając się na przyciąganiu i zatrzymywaniu najlepszych talentów technologicznych.

Developer experience, czyli DevEx, to podejście skoncentrowane na programiście, które ma na celu poprawę codziennej produktywności i wzroście satysfakcji.

Trend technologiczny #5

W obronie rzeczywistości: Prawda w dobie syntetycznych mediów

Wraz z rozpowszechnianiem się narzędzi sztucznej inteligencji, oszustom jest łatwiej niż kiedykolwiek wcześniej dokonywać podmian tożsamości i wprowadzać w błąd swoje ofiary. Technologia deepfake jest wykorzystywana do obejścia biometrycznej kontroli dostępu opartej na rozpoznawaniu głosu i twarzy. Dzięki łatwości generowania głosu brzmiącego jak prawdziwy, jest również używana w próbach phishingu. Ryzyko związane z utrzymaniem zabezpieczeń rośnie wraz z pojawianiem się każdego nowego narzędzia GenAI. Aby temu przeciwdziałać, firmy starają się łączyć polityki bezpieczeństwa i technologię, aby identyfikować szkodliwe możliwe ataki oraz podnosić świadomość pracowników w zakresie bezpieczeństwa.

Trend technologiczny #6

Core workout: Od długu technologicznego do technologicznego dobrostanu

Po wieloletnich inwestycjach w technologie, które kiedyś uznawane były za nowoczesne, przedsiębiorstwa stają teraz przed wyzwaniem związanym z koniecznością zmodernizowania kluczowych elementów, takich jak mainframe’y, sieci czy centra danych. Aby być gotowym na wyzwania przyszłości, konieczne jest porzucenie fragmentarycznego podejścia do obszarów długu technologicznego i zastąpienie go nowym, całościowym i kompleksowym.

Zapobiegawcze oceny dobrostanu, oparte na wpływie na biznes, mogą pomóc zespołom określić, które obszary „stosu” technologicznego wymagają uwagi, a które mogą nadal skutecznie spełniać potrzeby IT. W przyszłych latach firmy prawdopodobnie będą opracowywać bardzo dostosowany i zintegrowany plan obejmujący cały „stos” technologiczny, w tym inwestycje w technologie samonaprawcze, które zmniejszą potrzebę przyszłych modernizacji.

źródło: Raport: Trendy Technologiczne 2024