How 20 Years Have Transformed the Chemical Industry. The 2013 Chemical Industry Value Creators Report by Andreas Gocke, Yves-Pierre Willers, Jan Friese, Sarah Gehrlein, Hubert Schönberger, and Hady Farag; June 02, 2014
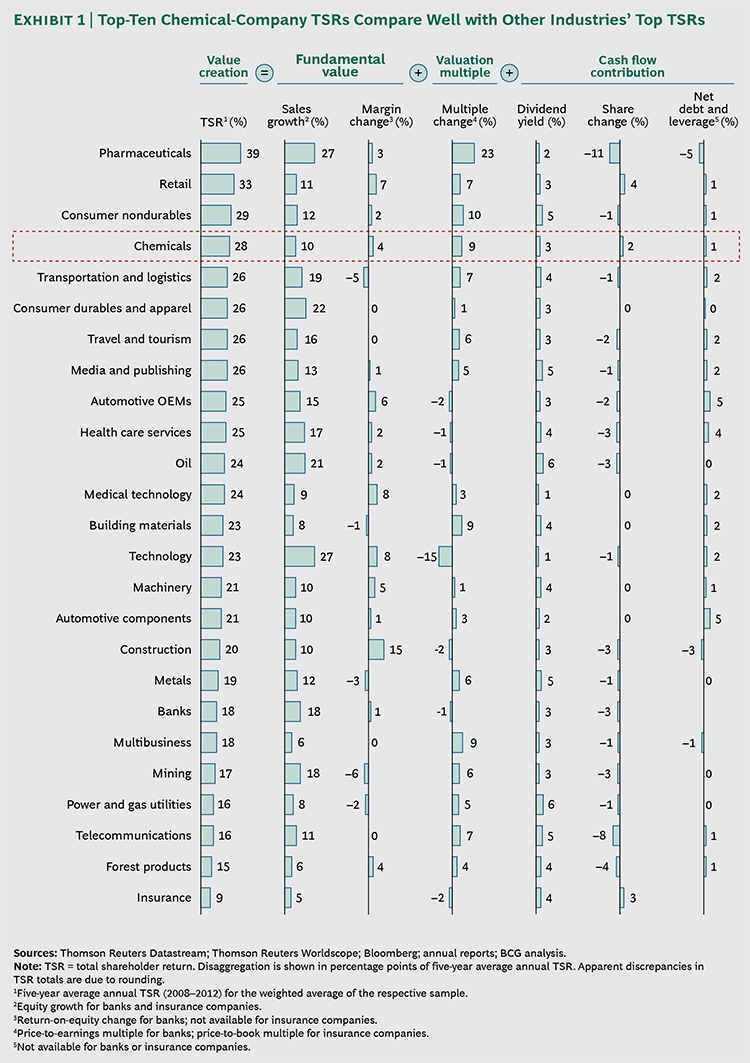
This is the second consecutive year in which The Boston Consulting Group has conducted a total shareholder return (TSR) analysis of the chemical industry. As we had expected, many conditions have changed since last year. The top ten chemical companies still have excellent returns—fourth best, in fact, among the 25 industries BCG analyzed. (See Exhibit 1.) But there have been some big shifts in the composition of the top-performer list. U.S. and European chemical companies have come roaring back, displacing the emerging-market chemical producers that were getting the best TSRs only a few years ago.
Another change is the relative improvement in TSRs among high-end chemical companies, as well as the simultaneous loss of TSR momentum among commodity chemical players, specifically in the agrochemical and fertilizer subsector. (See “How We Measure Value Creation: The Components of TSR.”)
How We Measure Value Creation: The Components of TSR
Total shareholder return, which accounts for share price development in a given time period (dividend payouts are also part of the calculation), is the product of multiple factors. Readers of BCG’s Value Creators series are likely familiar with BCG’s methodology for quantifying the relative contribution of the various sources of TSR. (See the exhibit below.) The methodology uses the combination of revenue (that is, sales) growth and change in margins as an indicator of a company’s improvement in fundamental value. It then uses the change in the company’s valuation multiple to determine the impact of investor expectations on TSR. Together, these two factors determine the change in a company’s market capitalization. Finally, the model also tracks the distribution of free cash flow to investors and debt holders in the form of dividends, share repurchases, and repayments of debt in order to determine the contribution of free-cash-flow payouts to a company’s TSR.
These factors all interact—sometimes in unexpected ways. A company may increase its earnings per share through an acquisition but create no TSR if the new acquisition has the effect of eroding the company’s gross margins. And some forms of cash contribution (for example, dividends) have a more positive impact on a company’s valuation multiple than others (for example, share buybacks).
TSR is a useful measure of value creation, but it is inherently backward looking. As such, it is not a reliable predictor of future returns.
In order to conduct a comprehensive analysis of the chemical industry, we scanned all of the world’s stock exchanges and included every chemical company whose market valuation was at least $2 billion at year-end 2012. In addition, each company’s shares had to have been listed for the entire time covered (we looked at three different time periods), and there had to be a free float of at least a quarter of the company’s shares. This scan gave us a list of 106 companies for the 5 years that ended in December 2012, 90 companies for the 10 years that ended in December 2012, and 61 companies for the 20 years that ended in December 2012. The larger samples from more recent periods result from the emergence of new companies.
Our purpose in looking at the three time periods was to get a sense of the success of the companies’ capital-deployment programs. In many industries—certainly in chemicals—it takes years to see the results of invested capital. The analysis of several time periods also allowed us to see how different chemical companies have fared in a variety of stock market environments and through a number of industry shifts. For instance, the 20-year period beginning in 1993 is when European chemical companies stopped trying to succeed as pharmaceutical companies as well. Imperial Chemical Industries’ spinoff of Zeneca that year was the pioneering transaction and was followed by a succession of similar portfolio moves that reshaped the chemical industry.
Some of the companies on our list are also involved in significant activities other than chemicals. As long as those activities are clearly secondary from a revenue standpoint, we have included the companies. We excluded companies whose chemical operations are eclipsed by other, more dominant industrial activities, including some oil and gas and mining companies.
more: ![]()